First session#
The first time EnSim starts it opens an example project, a small kerolox sounding rocket, so that every page has something to show.
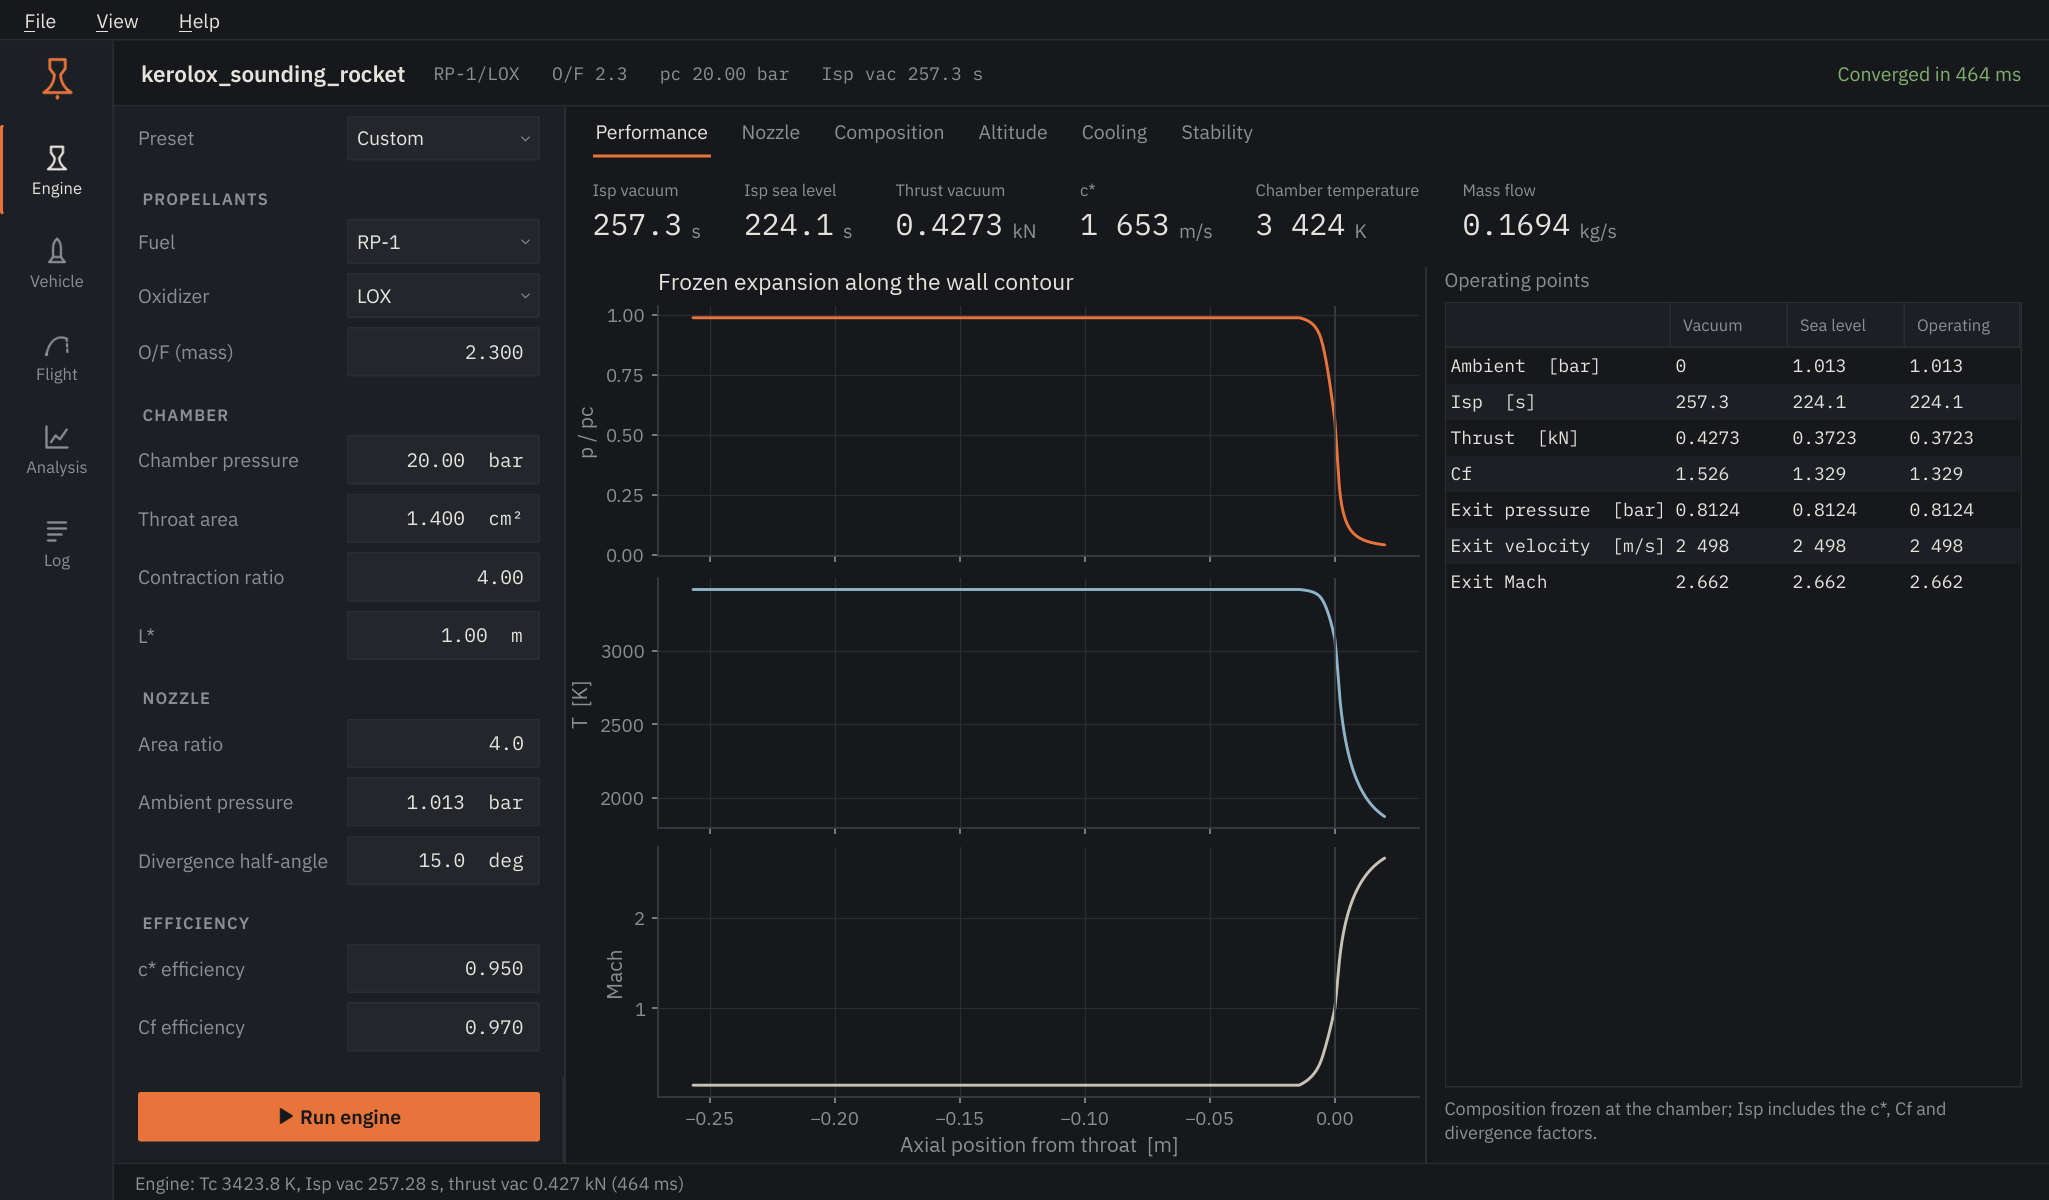
The layout#
- Navigation rail. Five pages: Engine, Vehicle, Flight, Analysis and Log.
Ctrl+1toCtrl+5jump between them. - Inputs. Each page keeps its own inputs on the left. Values are stored in the project as soon as you leave a field.
- Run. The orange button at the bottom of the inputs, or
F5, runs the page's main calculation.Esccancels whatever is running. - Header. Project name, a one-line summary of the last engine result and how long it took.
- Status line. Messages, and a thin progress line while something runs.
Calculations never block the window: you can switch pages, resize, or start something else while a Monte Carlo study is running.
Five minutes with the example#
- On Engine, press
F5. The metrics fill in and the plots show pressure, temperature and Mach number along the wall contour. - Change Chamber pressure to 30 bar and run again. Analysis → Compare can pin both results side by side.
- Open Vehicle. The drawing shows the centre of gravity with full and empty tanks and the centre of pressure. A static margin between 1 and 2 calibres is a comfortable target.
- Open Flight and press
F5. With the example's 4 m/s westerly wind the rocket weathercocks to the west on the way up and drifts back east under its parachutes. - In Flight → Dispersion, run 100 cases to see where the rocket might land.
Units and appearance#
View switches between SI and US customary units, and between the dark and light palettes. Values in the project are always stored in SI, so switching units never changes a design. View → Reduce motion turns off the short transitions.
Files#
Projects are .ensim files (plain JSON, see project files).
File → Export report writes a Markdown summary; Export results as JSON
writes every number the session computed. Right-click any plot to save it as
PNG or SVG, or to export its data as CSV.